Quickstart: Get Started with Observability
Last modified on 21-Apr-25
This quickstart walks you through enabling observability on a single dataset to help you explore Soda’s functionality as quickly as possible.
You will:
- Create a Soda Cloud account
- Connect a data source
- Configure your first dataset to enable observability
💡 We recommend enabling observability for a single dataset that updates daily and has been in use for a while. This gives you more meaningful results, faster.
You can always update or remove the data source later—this is just a test connection to explore the platform.
Step 1: Create a Soda Cloud Account
- Go to cloud.soda.io and sign up for a Soda Cloud account. If you already have an account, log in.
- By default, Soda creates a Soda-hosted Agent for all new accounts. You can think of an Agent as the bridge between your data sources and Soda Cloud. A Soda-hosted Agent runs in Soda’s cloud and securely connects to your data sources to scan for data quality issues.
-
If you are an admin and prefer to deploy your own agent, you can configure a self-hosted agent:
- In Soda Cloud, go to your avatar > Agents
- Click New Soda Agent and follow the setup instructions

Soda Agent Basics
A Soda Agent is a tool that empowers Soda Cloud users to securely access data sources to scan for data quality. There are two types of Soda Agents:
- Soda-hosted Agent: This is an out-of-the-box, ready-to-use agent that Soda provides and manages for you. It’s the quickest way to get started with Soda as it requires no installation or deployment. It supports connections to specific data sources like BigQuery, Databricks SQL, MS SQL Server, MySQL, PostgreSQL, Redshift, and Snowflake. Soda-hosted agent (missing)
- Self-hosted Agent: This is a version of the agent that you deploy in your own Kubernetes cluster within your cloud environment (like AWS, Azure, or Google Cloud). It gives you more control and supports a wider range of data sources. Self-hosted agent (missing)
A Soda Agent is essentially Soda Library (the core scanning technology) packaged as a containerized application that runs in Kubernetes. It acts as the bridge between your data sources and Soda Cloud, allowing users to:
- Connect to data sources securely
- Run scans to check data quality
- Create and manage no-code checks directly in the Soda Cloud interface
The agent only sends metadata (not your actual data) to Soda Cloud, keeping your data secure within your environment. Soda Agent basic concepts (missing)
Step 2: Add a Data Source
- In Soda Cloud, go to your avatar > Data Sources.
- Click New Data Source, then follow the guided steps to create the connection. Use the table below to understand what each field means and how to complete it:
- Complete the connection configuration. These settings are specific to each data source (PostgreSQL, MySQL, Snowflake, etc) and usually include connection details such as host, port, credentials, and database name.
New Data Source Attributes
| Field or Label | Guidance |
|---|---|
| Data Source Label | Provide a unique identifier for the data source. Soda Cloud uses the label you provide to define the immutable name of the data source against which it runs the Default Scan. |
| Agent | Select the Soda-hosted agent, or the name of a Soda Agent that you have previously set up in your secure environment. This identifies the Soda Agent to which Soda Cloud must connect in order to run its scan. |
| Check Schedule | Provide the scan frequency details Soda Cloud uses to execute scans according to your needs. If you wish, you can define the schedule as a cron expression. |
| Starting At (UTC) | Select the time of day to run the scan. The default value is midnight. |
| Custom Cron Expression | (Optional) Write your own cron expression to define the schedule Soda Cloud uses to run scans. |
| Column Profiling Scan Schedule | Specify the time of day at which Soda runs the Automation scan. |
| Automation Scan Schedule | Specify the time of day at which Soda runs the daily anomaly dashboard scan. |
| Partition column suggestion - Optional | Add any amount of partition column suggestions. If a suggested column name fully matches a column discovered during metric monitoring or profiling, that column will be used as the partition column. The order of the suggested columns matters, as they will be checked sequentially from top to bottom until a match is found. If no match is found, heuristics will be applied to determine the partition column. You can change the partition column at any time in the dataset settings. |
Use the appropriate guide below to complete the connection:
- Connect to BigQuery
- Connect to Databricks SQL
- Connect to MS SQL Server
- Connect to PostgreSQL
- Connect to Snowflake
Step 3: Test Data Source Connection
Click Test Connection at the top to verify that all connection settings are configured correctly. 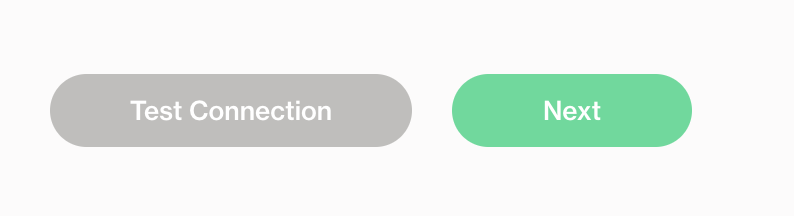
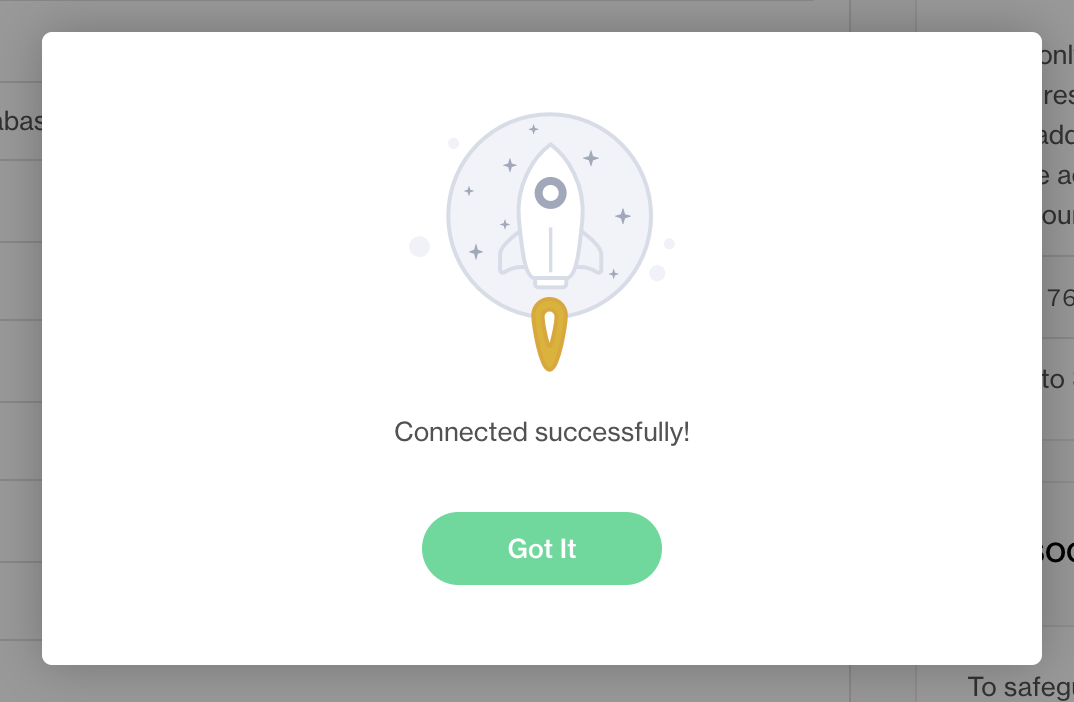
If everything is configured properly, you’ll see a success screen like the one below.
Step 4: Configure Dataset Discovery, Profiling and Anomaly Detection
In this step, you define which datasets and columns Soda will monitor, and enable anomaly detection to automatically surface issues.
4.1 Dataset Discovery
Dataset discovery collects metadata about each dataset, including its schema and the data types of each column.
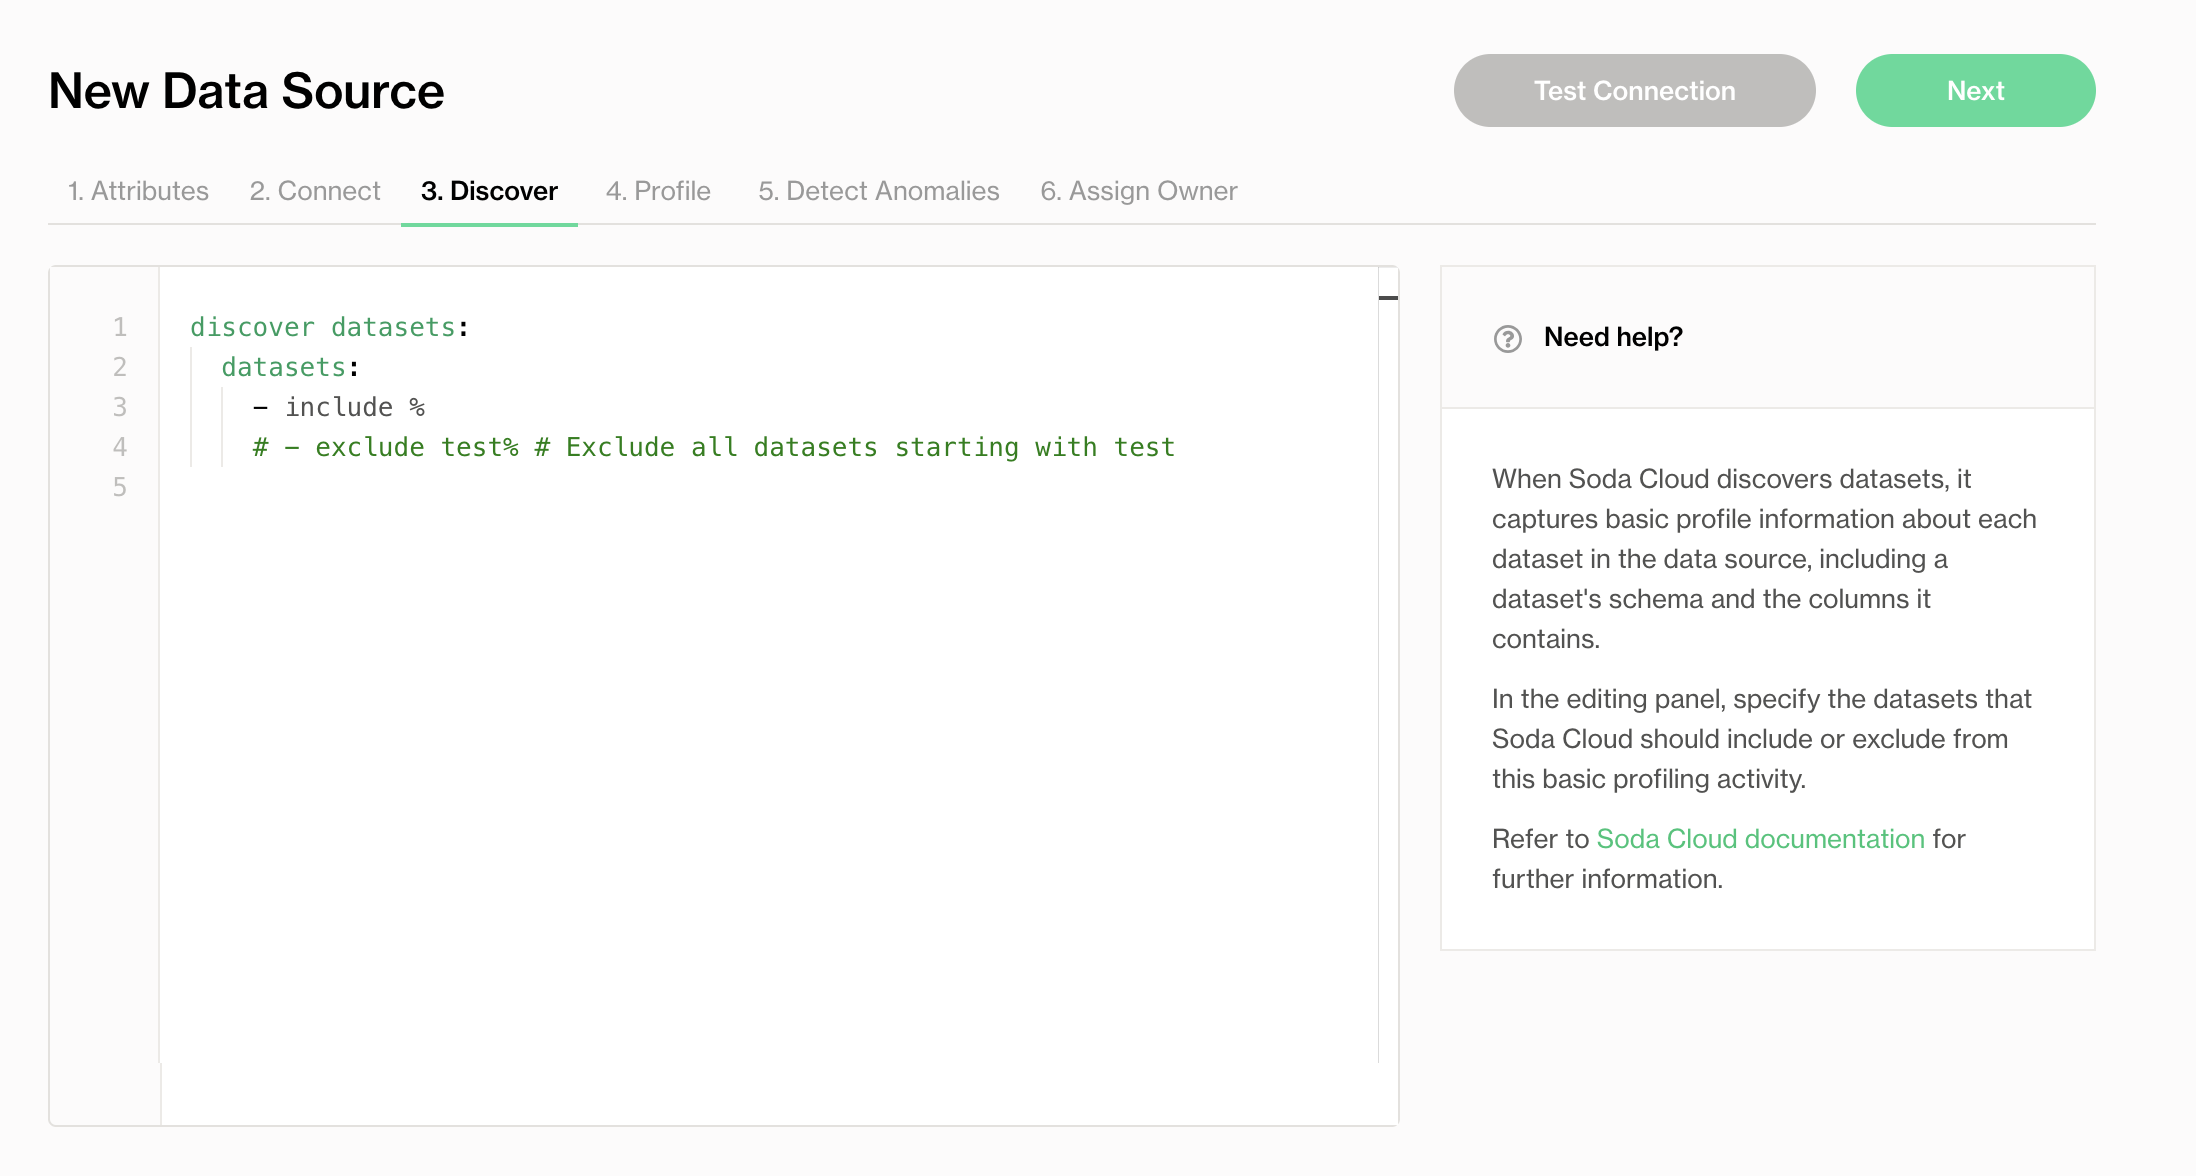
Specify the datasets you want to profile. Because dataset discovery can be resource-intensive, only include datasets that are important for observability.
See Compute consumption and cost considerations for more detail.
4.2 Column Profiling
Column profiling captures metrics such as the mean, minimum, and maximum values in a column, as well as the number of missing values.

Use include/exclude patterns to specify which columns Soda should profile. These metrics feed into the anomaly dashboard.
By default, Soda includes all datasets in the data source. If you’re just testing the functionality, you can leave the default settings and click Next to continue.
4.3 Anomaly Detection
In the Detect Anomalies tab, define which datasets should be monitored for anomalies like schema changes or unusual metric behavior.
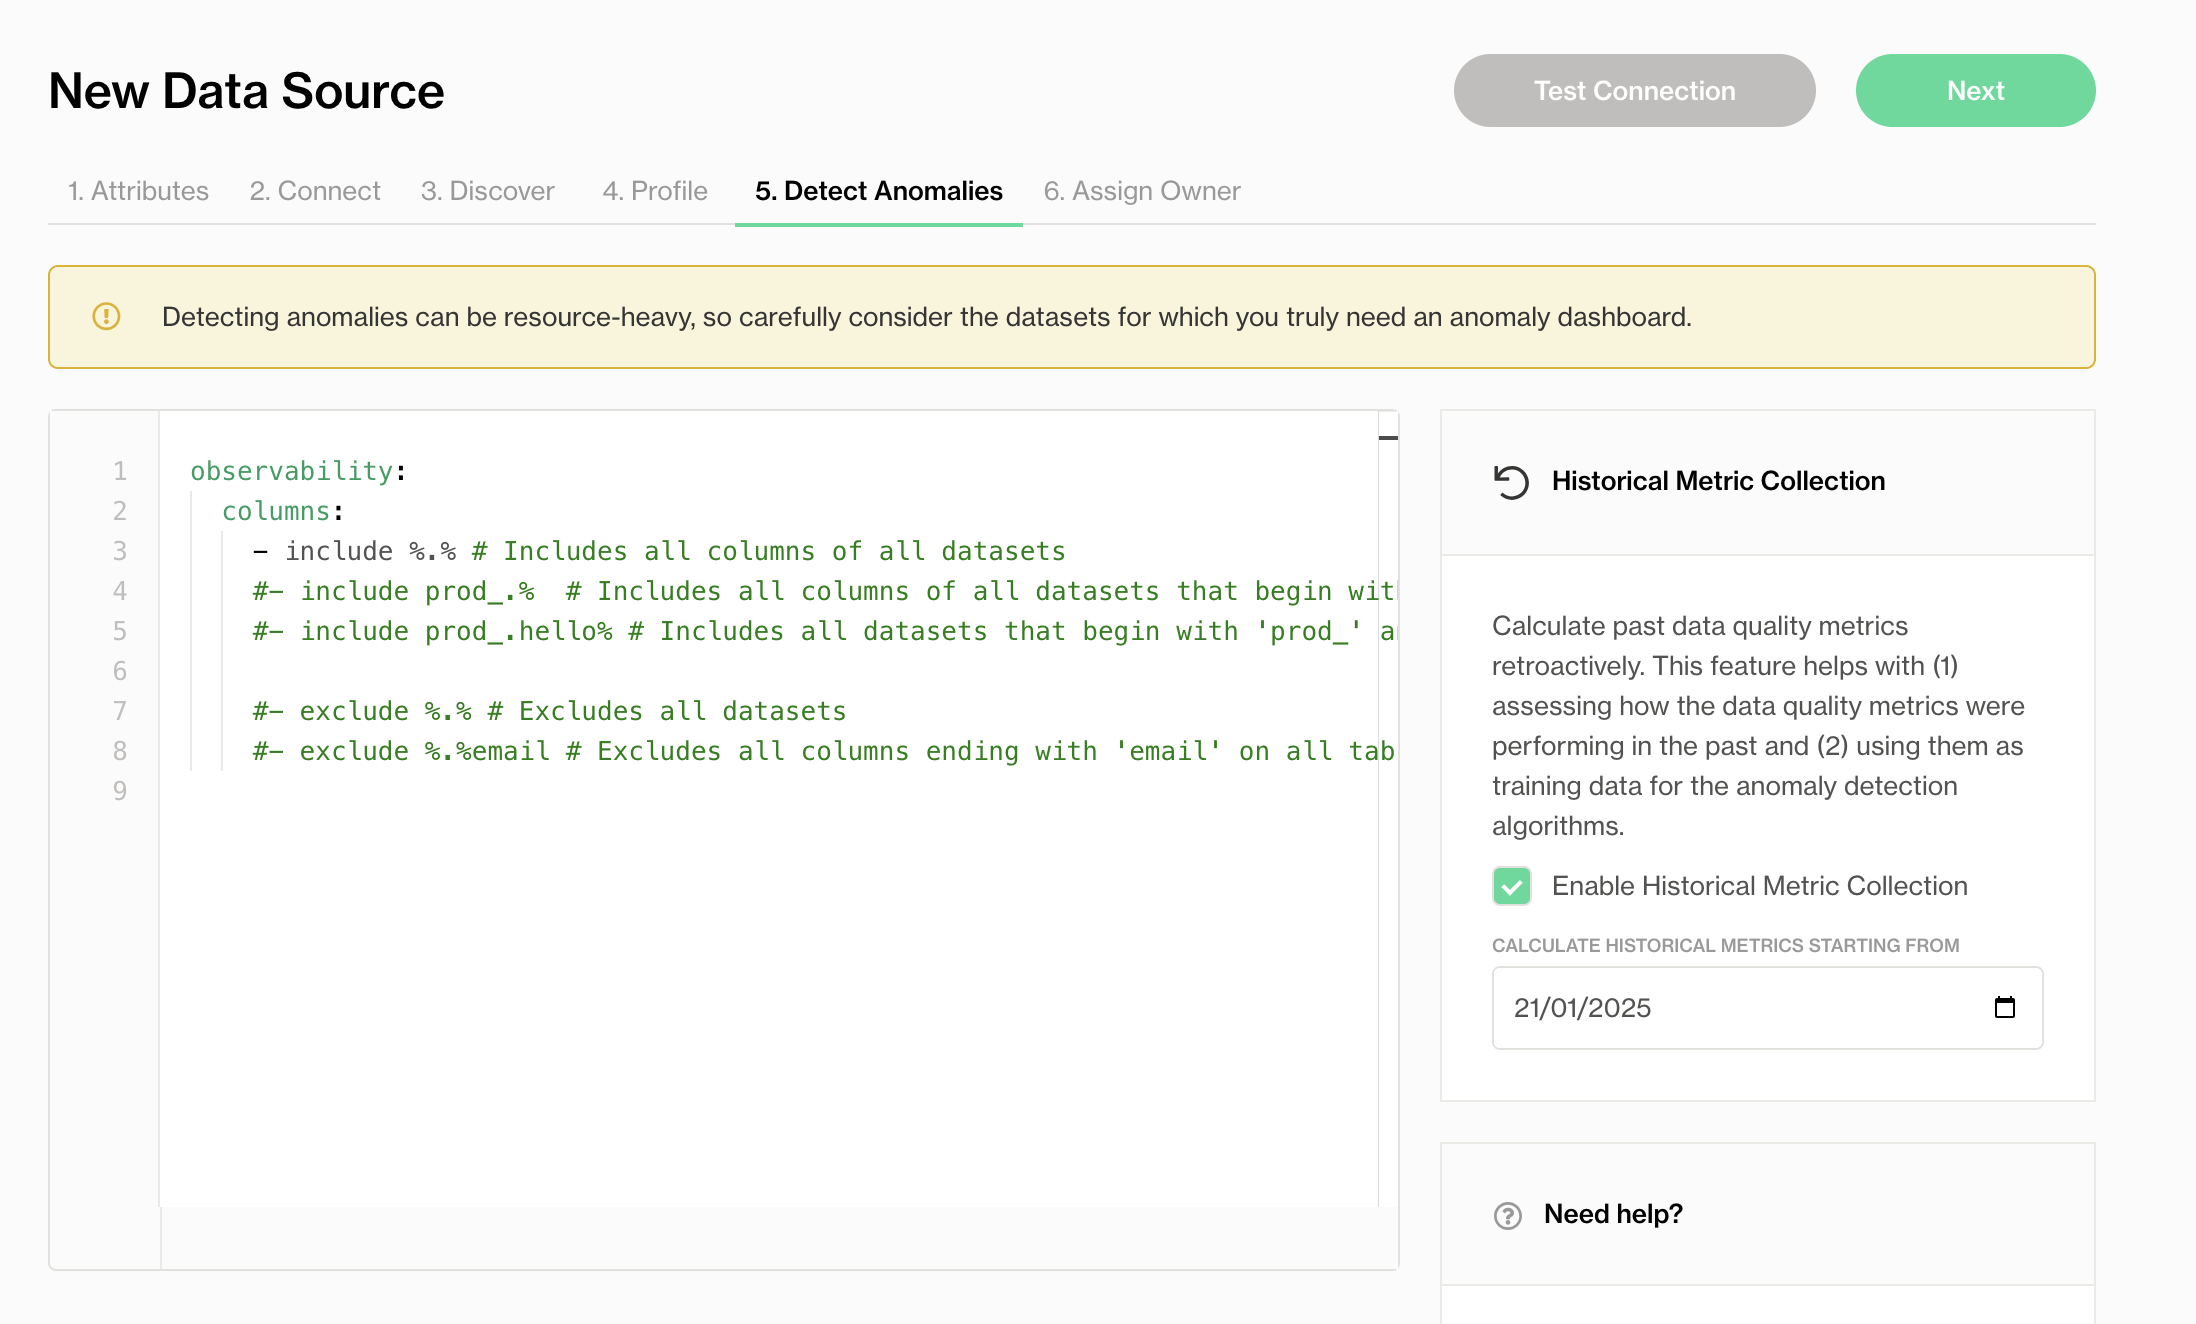
Use include/exclude filters to specify the datasets to monitor with Metric Monitors.
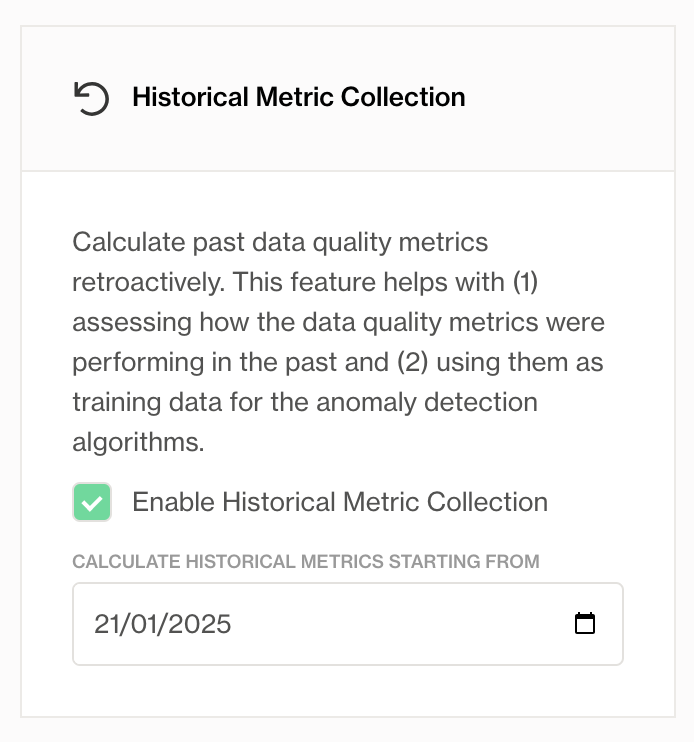
You can also enable historical metric collection to calculate past metrics and provide training data for the anomaly detection engine. This helps with:
- Assessing how the data quality metrics were performing in the past.
- Using them as training data for the anomaly detection algorithms.
Step 5: Assing a Data Source and Dataset Owner
Assign responsibility for maintaining the data source and each dataset.
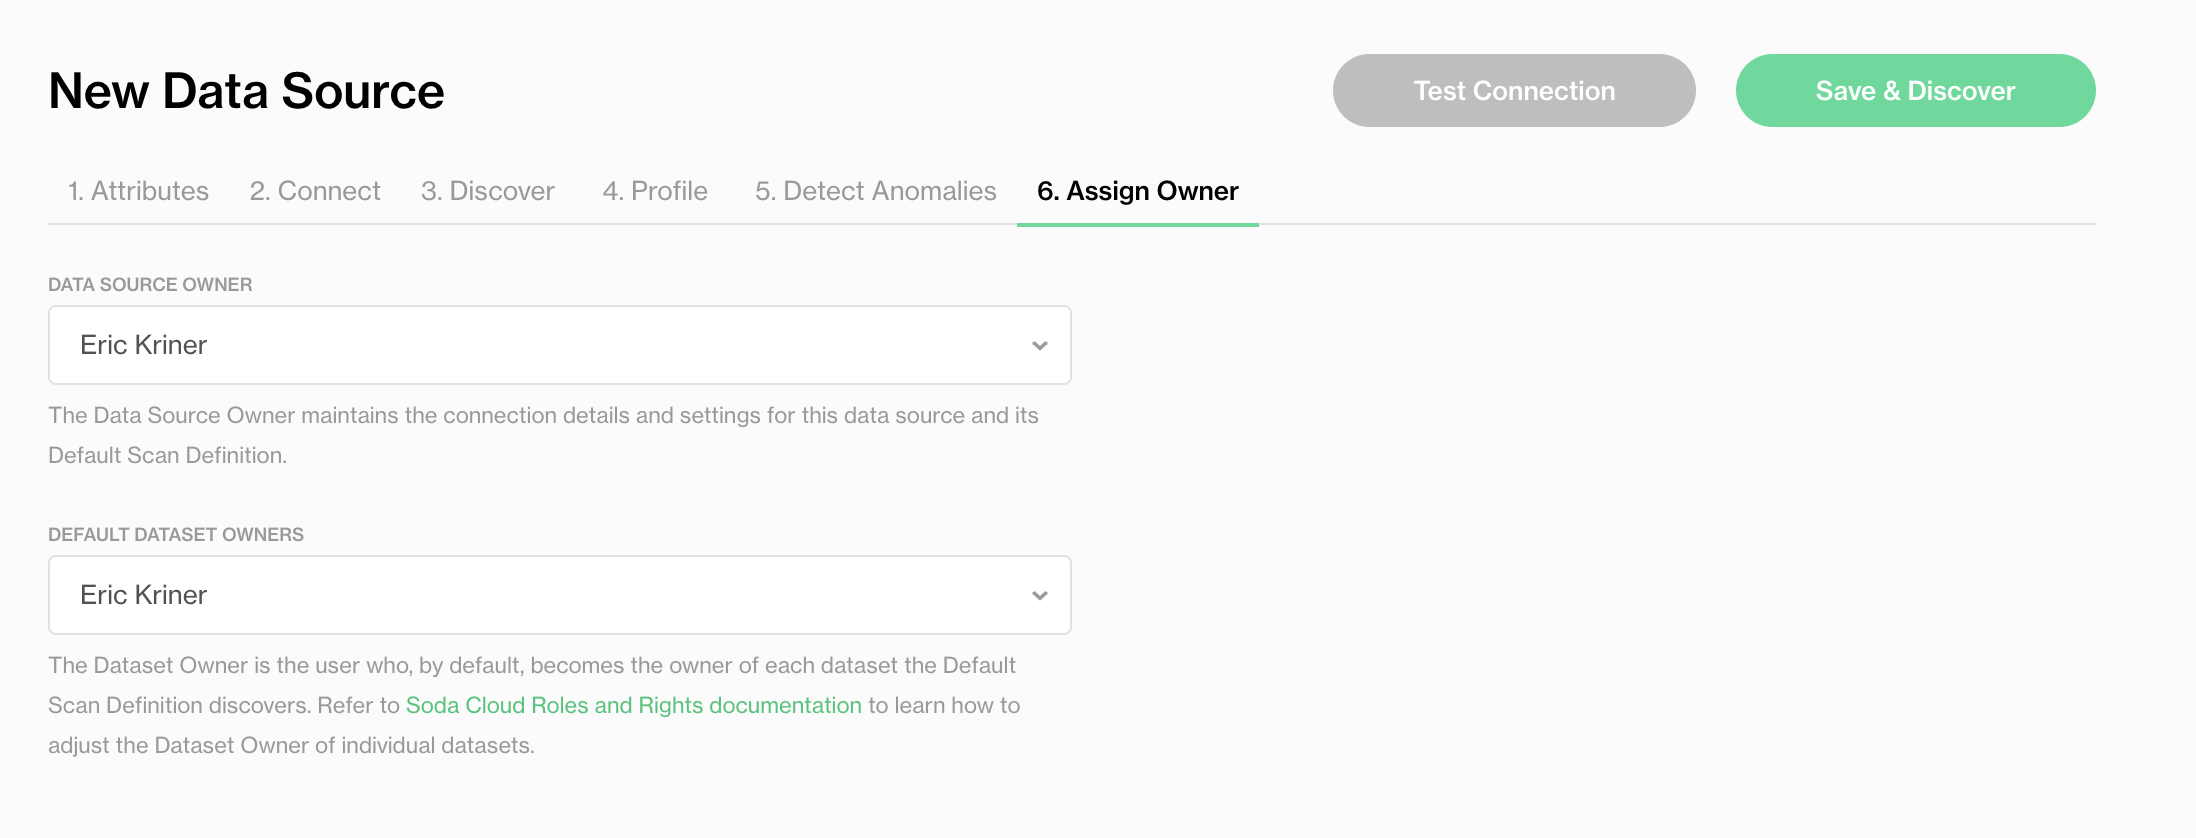
- Data Source Owner: Manages the connection settings and scan configurations for the data source.
- Dataset Owner: Becomes the default owner of each dataset for monitoring and collaboration.
For more details, see Roles and rights in Soda Cloud.
Step 6: Test Connection and Save
- Click Test Connection to verify your configuration.
- Click Save to start profiling the selected datasets.

Once saved, Soda runs a first scan using your profiling settings. This initial scan provides baseline measurements that Soda uses to begin learning patterns and identifying anomalies.
Step 7: View Metric Monitor Results
- Go to the Datasets page in Soda Cloud.
- Select a dataset you included in profiling.
- Open the Metric Monitors tab to view automatically detected issues.
After the historical metric collection scan is complete (this usually takes just a few minutes), you can review the results.

On this screen, you’ll see the following metrics:
| Metric name | Based on | How it’s calculated |
|---|---|---|
| Total Row Count | metadata | The total number of rows in the dataset at scan time obtained from metadata. |
| Total Row Count Change | metadata | The total number of rows at the previous scan time deducted from the current total row count obtained from metadata at scan time. |
| Last Insertion Time | metadata | The time of last insert at the scan time obtained from metadata and deducted from the scan time. |
| Schema Changes | metadata | The number of changes in the dataset schema at the scan time compared to the previous scan. |
| Partition Row Count | data | The number of rows inserted in the last partition. |
| Most Recent Timestamp | data | The most recent timestamp in the time partition column at scan, deducted from scan time. |
🎉 Congratulations! You’ve set up your dataset and enabled observability.
What’s Next?
Now that your first dataset is configured and observability is active, try: